
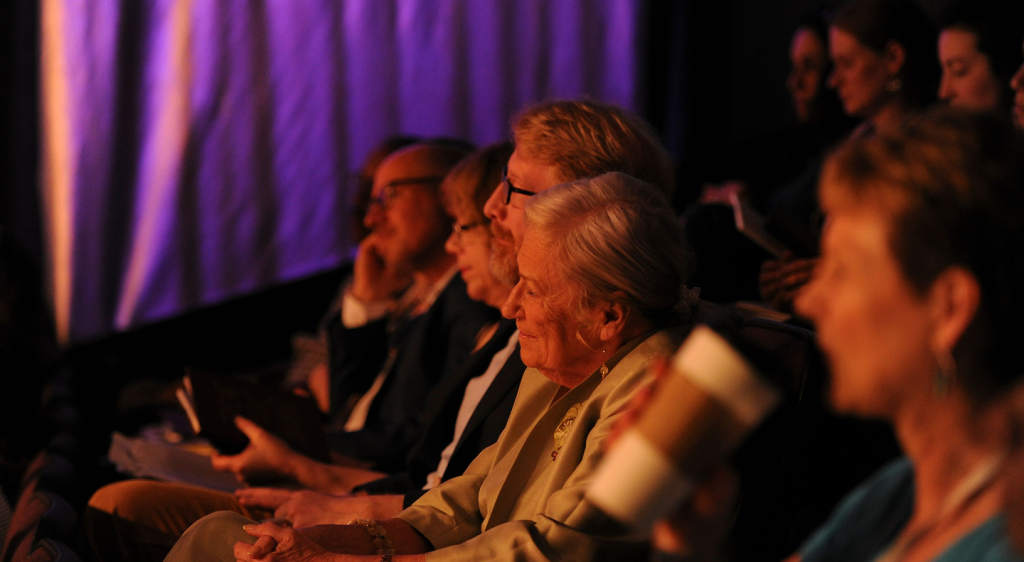
Fresh From the frank Stage
Standout talks from the most recent 2023 gathering, featuring bold voices, urgent truths and unforgettable moments.

Amahra Spence
Liberation Rehearsal Notes from a Time Traveler

Shanelle Matthews
Narrative Power Today for an Abolitionist Future
Nima Shirazi
Irresistible Forces, Immovable Objects
The Speaker
Watch Next
-
 The Ethics of Button Pushing: Using biometric and AI for Media Effects Research
 -
 It All Adds Up
 -
 The Play’s The Thing
The Speaker
Untitled
Forecasting Society from the Global Heartbeat
Behavioral ScienceCommunicationsFamilySocial MediaTechnology
Transcript
Thank you so much for having me here today. It’s incredibly exciting. So I want to tell you a story. A story that begins four and a half billion years ago with the creation of this beautiful planet called Earth. About a billion years go by until the first life started swimming around that terrestrial ocean. A few million, a few more billion years go by until about 50,000 years ago the first human, the first modern human started walking around. What’s really exciting is about 38,000 years ago something really extraordinary happens. The first surviving evidence of cave paintings show up. Those early shivers, they’re trying to make a perfect record of what’s happening, what they’re doing, and their dreams, and their fears. 8,000 years ago the first surviving evidence of writing begins apparently. 500 years ago the printing press shows up allowing us to exponentially create incredible amounts of information. 20 years ago the web browser, 10 years ago arguably social media shows up. Each of those bringing with it an exponential rise in the availability of information of this documentary record of human society. And this is really exciting because you think about this incredible amount of information that’s capturing who we are and what makes us human. Fast forward to today and we’ve reached an incredible point in human history. Electricity is reaching the furthest most regions of society. With the rise of electricity, with the rise of electricity comes the march of media. Today even the most remote region, the most remote element of power, brings with it Twitter. Essentially where there’s power there’s Twitter. And with this we can begin to peer into the soul of society. We can do something like in the global code heartbeat project but we can call code every single tweet by the language spoken in that tweet. And we can zoom in. We can start actually looking where national boundaries occur. Not where some politician who aligns with that but actually where people stop speaking one language and where they speak another. We can drill into the core of the city. Understand for example when people from France visit London, what do they visit? What are the core areas that they enjoy? And this is something phenomenal. The ability to really peer inside society for the first time. And our space work today, I’ll be able to have a billion members connected by over a trillion relationships. Now obviously a lot of those accounts are someone’s cat for the statue of liberty or someone. But still it’s amazing. It builds you the data that you can take a platform, one single data source and make a map like this. And try to essentially map human society and what connects us. It’s a really exciting moment to be in today. But of course we can’t forget mainstream media. It builds you the data to take for example the Internet archives, television news archives to process half a million hours of American television news. 2.7 billion words of closed captioning. And have machines process through that in a matter of hours. And generate a map. Of the last three years every location on earth has been mentioned in American television news. And the ability to really essentially peer inside and say well you know Africa for example, does American television news even cover that? To the public the positive light or negative light? Is it always that when it covers Europe it’s for financial news, when it covers Africa it’s for conflict? But the first time we can answer these questions. We can actually explore policies. As new policies for example Obamacare come out. We can actually watch how the nations reacting to that literally second by second. As we devise new communication strategies and put those out there we can actually watch how those play out. It’s no longer where you sort of come you come up with a messaging plan put it out there and cross your fingers. So then you can actually watch it. You can actually evolve and tailor it as things are happening. You know and to put all this in perspective you look at you look at where we are today. I mean a third of the global population is online. There are many cell phones because people on earth and I just love that number. You think about this and you think about something like Star Trek. I mean Star Trek all that all he had was a little radio basically. You know today’s phones they connected to that global name. And this is this is really exciting. That’s book amazingly 240 billion photographs. You think about you know the average college kid today by the time they graduate how much they uploaded to Facebook. I mean pretty much every Friday night they document incredible detail. We have more than the average college student they don’t have on heads of state. You know and you think about you know every year this last number I love. One million days with the video are uploaded to YouTube every single year. You think about the amount of video and this isn’t just production broadcast material anymore. You know this is actually real stuff from around the world. You know so this is every year every day. I think there’s almost three billion now. New items are added to Facebook. Pretty good million photographs are posted to Facebook. I mean that just amazes me. How about that about new data while societies in and around sports are posting every single day. There’s many words posted to the Twitter every single day as in the entire New York Times over the last half a century. You think about that. By some estimates there’s almost a hundred billion social media actions taken every day. I mean read across all the platforms. You think about the amount of data this is giving us on what makes us human. Every minute six hundred websites created. You know a quarter of a million tweets. You think about what this means in terms of this this this is an incredible line of material. Now what’s most exciting to me is that this incredible explosion of data has come with an explosion of computing power. You know you think about you know we talk about we’re drowning in data today. We’ve always been drowning in data. In fact many of our brain structures actually form in the dawn of early humans. They see that furry creature over there and they have to ask themselves in a split second. Is that a potential watch or is that I mean is a potential watch. And so our brains have developed all these structures to be able to rapidly process and synthesize information. But today you think about it we’re live digitizing the world. All this online communication is occurring through electronic platforms. People are running around photographing logging tweeting about everything that’s happening. So essentially our digital and our physical heartbeats are increasingly needing is one and those are transiting the global network of computers. They can process that that can map that model that visualize that allows to release our understanding human society. This is this is very very exciting. You know citizens themselves are becoming a vast ground-based social sensor network. You know today you think about it the first confirmation of Gaddafi’s capture you know was actually a cell phone video shot by participants themselves and upload to YouTube shortly thereafter. The super secret takedown of the summit in Laden who’s live tweeted by Pakistani journalists in actually on the ground actually tweeting that strange non-Pakistan military cold cops were flying over here. He’s confirmed here in the U.S. not by an official statement in Rose Garden but by a former administration official who tweeted I just heard from my buddy in the White House. We got you think about this kind of information and what this means. You know this is this is kind of exciting. I love this image here. This is the election of the pope 2005-2013. I’m just going to put that whole little camera call there. It was really interesting about this. You think about this the only image that would have of that election of the 2005 is really what the major news network decided to give us. I mean you know in 2019 I love the iPad. I love how people hold up these gigantic you know iPads. You think about this you know this today every one of these people I’ve met you was instantly up one nose on Flickr, Facebook, Twitter, Instagram, etc. So we have every one of those people giving us a unique perspective and probably giving commentary on how they’re feeling about this and what this means up here the old days people have control of the view. They control what people saw. Down here you know someone trips and the old days that might that probably wouldn’t be edited out. Today you know we’ll have very bitter in fact that’ll probably be where they’ll get between the monks and so you think about you know what this in terms of how this is changing in terms of how this is giving us you know this ability to view things. This is a fascinating graph. This is the percentage of all news media worldwide everything is available to be electronic means. So it really attracts the rise of the web itself. In about 2010 almost half of all media with the broadcast print every language in the world was available in some form in electronic means on the web especially. And this is interesting because a low say 10 watt broadcaster in southern Zimbabwe that’s very difficult to monitor to measure to do something. You have to be there. You can’t screw that up from the embassy in the capital. You can’t get at that from satellite in space. You have to be on the ground to get that. The moment something’s available on the web it means computers can grab it. They can process it. They can understand it for us. This is really exciting. You think about it if everywhere at a point we can start measuring the heartbeat of global society we’re fast approaching that. Today people from Bangladesh for one or two hours visit they tell one another and their neighbors what they’re seeing what they’re feeling what they’re thinking what’s important to them. You think about you know you think about what this means but what’s particularly interesting to me is you think about today when an earthquake occurs anywhere on earth you know we know about incident United States Geologic Survey within seconds they have it their map they’re showing where it happened where it’s spreading whose life could be affected. But think about protests you want to make a map of every protest that occurred in the world today. We don’t want to have the days to do that today. We know so much more we’ve instrumented this planet to the extreme. We’ve satellites spinning around watching it. We have sensors across the entire planet measuring every little movement on earth. We don’t have the same for human society. But you think about all this mainstreaming all this social media all this stuff it’s an incredible live documentary society. What happened if we if we start trying to capture that if we essentially try to say well why don’t we use all this as a sort of a table to society. So imagine a world in which essentially you have computers we know all the world’s news media every day computers read all that and codify them. So imagine for example in a news article that says Iraqi leaders criticize Turkey on Monday because bombing Kurdish militants in northern Iraq. Imagine a computer that basically takes that sentence reads through that and says well there’s an event here the Iraqi government is criticizing Turkey and Turkey was bombing Iraqi Kurdish rebels. So once you have a computer that can basically take this this taxes free form text and you’ve heard that to essentially a spreadsheet entry. You can make a map of the Egyptian unrest as it’s unfolding moment by moment and actually sketch out there’s more process here now they’re spreading here now they’re spreading this way. You can start measuring well how many people are about oh look now this is this is doubled in size here. This is a very exciting moment and very possible today. We’ll actually look we actually then zoom in and see that unrest and not just see well boy there seems to be a lot of news covers about something happening in Egypt. We actually zoom in and see building my building where it’s happening. We can literally innovate this and actually watch as as things are happening right before ours. In other words taking that massive amount of information the society is pouring out every day and essentially capture that in a way that we can analyze we can visualize we can model we can potentially even forecast. We can start taking a country for example Afghanistan something that obviously there’s there’s phenomenal interest in here in the United States and be able to make a map for example of everything that’s occurred there that’s made the global news media in the last quarter century to be able to visualize you know where take every violent event that’s occurred in the last quarter century that’s been recorded by the world’s news media and let me make a map of that and be able to understand the trends be able to even forecast and say well where are things going to happen in December of last year where are things going to happen this upcoming June we’re going to make a trial and this is very exciting. Do you think about it you know oftentimes things have cycles behind them we all know about sort of you know these these various cycles of history whether that’s an anniversary so certain for example certain areas of the world there’s unrest at every single anniversary well for the first time we can actually look at things with skill enough to actually uncover those patterns so for example we can actually make a time line actually visualize the history of the last quarter century and actually see where there’s been unrest we can see for example 2010 we can see there’s a lot of unrest in the beginning a probably quiet period and then more unrest it actually starts we can start actually understanding what are these these micro and micro level patterns that undergird human society itself we can do things for example we can take every every single day and this is actually a live pool we have today every single day we look at the last 48 hours and we basically count up every riot every protest every violent attack across the entire planet and we compare that to the two days prior to that we basically make a daily map that shows us what is violence everything is flowing across the world and this is kind of exciting because even even a government analyst for example they’ll be responsible for a particular country say I don’t know Cambodia and that analyst their job is to really understand everything happening in that country but because of that they can’t always watch the rest of the world in fact they they’re assigned not to but machines can machines have the bandwidth to literally absorb and this past January I did one for all 2013 compared to all 2012 almost 70 million events were included in that map from almost three quarters of a billion news references to all that material no human could ever not even a massive team of humans could ever process that much material but to a machine it’s just a few hours of order and the ability then to really start understanding well you know how is unrest really really sort of training heavy and flowing the ability to essentially sort of take the human out of the little mean humans will always be there because I say diplomacy will always be about the same shape but machines allow us to sort of figure out well whose hands should we shape when and where this was a project I did recently so last year NBC sci-fi approached me and said we want to rethink interactive television we want to move beyond things like say The Voice where sort of you know tweet the same year your favorite character and however whoever gets the most tweets wins they said you know we want to do something that actually goes through the entire duration of the show so for the show that they call it’s their and uh envy or sci-fi’s new flagship reality show called opposite worlds what we felt was a leader we’re essentially from all the characters in the show and second by second over the entire duration of the show we measured every tweet about the show on twitter and for every one of those we built what may be one of the one of the most sophisticated sentiment analysis systems for twitter almost 1.6 million words phrases colloquial expressions misspellings and other sort of cultural references that were built into that using this incredible hile of techniques and what’s interesting is that this literally this literally these these actually move second by second you can just wonderful to watch the show and actually have this iPad in front of you and actually watch the show play out it’s really amazing you know the first show one of the characters was the most popular and he shoves the other character off to the gulf in this whole podium they’re supposed to fight it out actually for those of you who are star wars fans the third star wars really were general grievous his guards have those kind of tasers on a rod that’s literally actually had they put these people up on the platform literally teasing each other and what was interesting is that very first show one of the people they’re supposed to walk up to the platform against grass and go well the first one basically shoves the other guy off the platform breaks both of his legs and so it was interesting is the guy that shoved the other one off he was the most popular but actually actually shoved the one you saw literally his ranking just dropped instantly you literally saw before your very eyes and it’s very exciting because if you were just measuring volume of tweets that doesn’t do much for you you know you see well this guy’s the most popular he’s getting the most tweets but it’s not because everyone loves him it’s because people hate him you know and the ability also to place these spaces understand not just but today we primarily just deal with tone in terms of time for those of you that you know most of you probably use various twitter analytic tools that measure tone through time but obviously toning space is even more critical the ability to tie it to things so not just saying well you know I’m I work with them you know I want to know the tone towards their shoes you want to understand what was really undergoing that so there’s these massive models that sit behind this that allow us in this actually plays in the show where every week then the character of the most popular and least popular actually got rewards and punishments and I was showing this all around Washington and and when I started hearing from everyone was well could you do this for world leaders you know could you produce that same brand before you could make your idea next and so could you go this also is now updated daily every morning the issue of actually a PDF report we rank every leader in the entire world by how positive of course you could see both world leaders are pretty negative people don’t usually say hey Brock along so you have a fantastic job today we love them isn’t it great period you know news here negative news is what’s up and so it’s quite interesting though what’s most powerful is the ability to watch how they move three times in space how these flow kind of most negative and in particular to be able to do something like this to try out for example Assad and chart out his global popularity in the world’s biggest media day by day over let’s say the past year and it’s very interesting when you do something like this you can see actually well his population is actually increasing over a period which you might which is kind of interesting you say well there’s a civil race killing all these people but what’s most very interesting is very clear so you can see that so the spread dot right here is the chemical weapons attack on Aleppo and you can see that you know he’s actually increasing and then some really bad stuff happens he starts losing ground fast and he’s losing and this is actually what we call the the death spiral of the leader when they enter a downward you’re actually like this usually they end up they end up basically being forced out for the quickly and then something happens Aleppo happens and you might say well you know we expect that you know he’s just gonna bottom out of that but something very interesting happens we’ve actually confirmed this now by going back through all the media from this period you notice that this is Aleppo he goes really downhill what happened is when Aleppo occurred and the world didn’t intervene you saw a pause and then you saw the entire world’s news media sort of say across the entire world if he can do that and no one intervenes not even a symbolic sort of you know shoot a cruise missile over his head he’s essentially vulnerable now you know if he can do this essentially if the rebels start winning he’ll just gas anyone that stands as his way so this is very interesting because really ended up actually being the moment that he’d be stabilized as a leader and what’s interesting of course the Nabokha tap which you know there’s some interesting things about that but you start seeing this again to a similar downward trajectory this seems to be kind of where he reacts to these really war sustained and again this sort of recovery period and of course this is very interesting because these sort of rises in his sort of global media tone really also represents the periods where he actually represents the United Nations issues its mandate to all the UN news agencies worldwide to not do any negative coverage of him of course you can see Ukraine we can do this for various leaders and really start understanding we can start kindness to events in the ground now imagine for a moment though a world in which you could make essentially a war room essentially trying everything that’s occurring around the planet at any moment and literally see it second by second playing out around you you could take for example Ukraine and map out everything that’s occurring you just did this after a Friday take Nigeria and look at for example protests occurring one side and more violence on the other or most excitingly imagine taking every news article over the past year extracting on every person from every article published anywhere in the world every broadcast every everything connecting all of them to every article connecting all of them making one massive network of entire global society imagine they will do that and understanding essentially the global conversation imagine being able to do this in real time every single day and really understanding in a whole new way what makes us human and what makes full society function thank you very much
Watch Next
-
The Ethics of Button Pushing: Using biometric and AI for Media Effects Research
-
It All Adds Up
-
The Play’s The Thing